2 Sustainable solutions (environmental matters)
2.1 Climate scenario analysis (ESRS 2 IRO–1)
Bystronic conducted a climate scenario analysis aligned with the TCFD framework, evaluating business resilience under 1.5°C and 3°C scenarios.
We are changing our scenario from 4°C (2024) to 3°C as several recent scientific assessments suggest that the likely global warming by the end of the century may be somewhere between +2 and +3°C, lower than the previously feared +4°C scenario. But this depends heavily on global emissions, trajectories and climate policies. Global temperatures in the last 12–18 months have consistently been ~1.3°C above pre-industrial levels. This leaves an extremely low remaining carbon budget to remain below 1.5°C.
While organizations should continue to align with 1.5°C pathways whenever possible – because these trajectories drive the deepest, fastest and most transformative decarbonization – they must also realistically prepare for the physical impacts associated with a 2–3°C world, which is increasingly becoming more likely. In this context, climate adaptation becomes as essential as mitigation, requiring companies to strengthen their resilience to extreme weather, supply-chain disruptions, and regulatory shifts. Those that decarbonize early will be significantly better positioned under tightening climate policies and escalating physical climate risks, gaining strategic advantages in competitiveness, compliance, and long-term value creation.
2.1.1 Scenarios evaluated
- 1.5°C scenario (Paris Agreement): Rapid transition to low-carbon economy. Strong carbon pricing. Accelerated renewable energy deployment. Stringent regulations on industrial emissions. Increased demand for low-carbon technologies.
- 3°C scenario (current policies): Limited climate action. Physical climate impacts intensify. Extreme weather events increase in frequency and severity. Supply chain disruptions from climate events. Reduced regulatory pressure but higher physical risks.
2.1.2 Key findings1
- Steel price: in a 1.5°C scenario, increased demand for renewable energy technologies and low-carbon products could drive demand for steel, potentially leading to higher prices. However, increased investment in steelmaking technologies could mitigate price increases. In a 3°C scenario, decreased demand due to reduced economic activity could lead to lower prices, but increased physical risks could disrupt supply chains.
- Carbon price: in a 1.5°C scenario, increased adoption of carbon-pricing policies could lead to higher carbon prices over time. In a 3°C scenario, less political will for carbon pricing could lead to lower prices or insignificant carbon pricing.
- Regulation: in a 1.5°C scenario, increased regulatory pressure to reduce emissions potentially leads to new regulations on industrial emissions and investment in low-carbon technologies. In a 3°C scenario, there would be less regulatory pressure in the short term.
- Electronic price/supply chain disruption: in both scenarios, increased physical risks from climate change such as extreme weather events could disrupt the supply chain for electronic components. In a 1.5°C scenario, increased investment in low-carbon technologies could drive demand for electronic components used in renewable energy technologies, potentially driving up prices. In a 3°C scenario, decreased demand could lead to lower prices, but increased physical risks could create supply disruptions.
- Implications: findings help fine-tune key development areas to enable active contribution to a low-carbon transition, notably development of sustainability portfolio offers. Bystronicʼs cleantech solutions position the company to benefit from a 1.5°C scenario through increased customer demand while physical risk adaptation ensures resilience in 3°C+ scenario.
- UNEP Emissions Gap Report 2025 | Climate Action Tracker | NGFS Phase V Climate Scenarios | IEA World Energy Outlook 2024 | EU ETS price forecasts, EUROMETAL/Fastmarkets, Bruegel Working Paper 20/2025
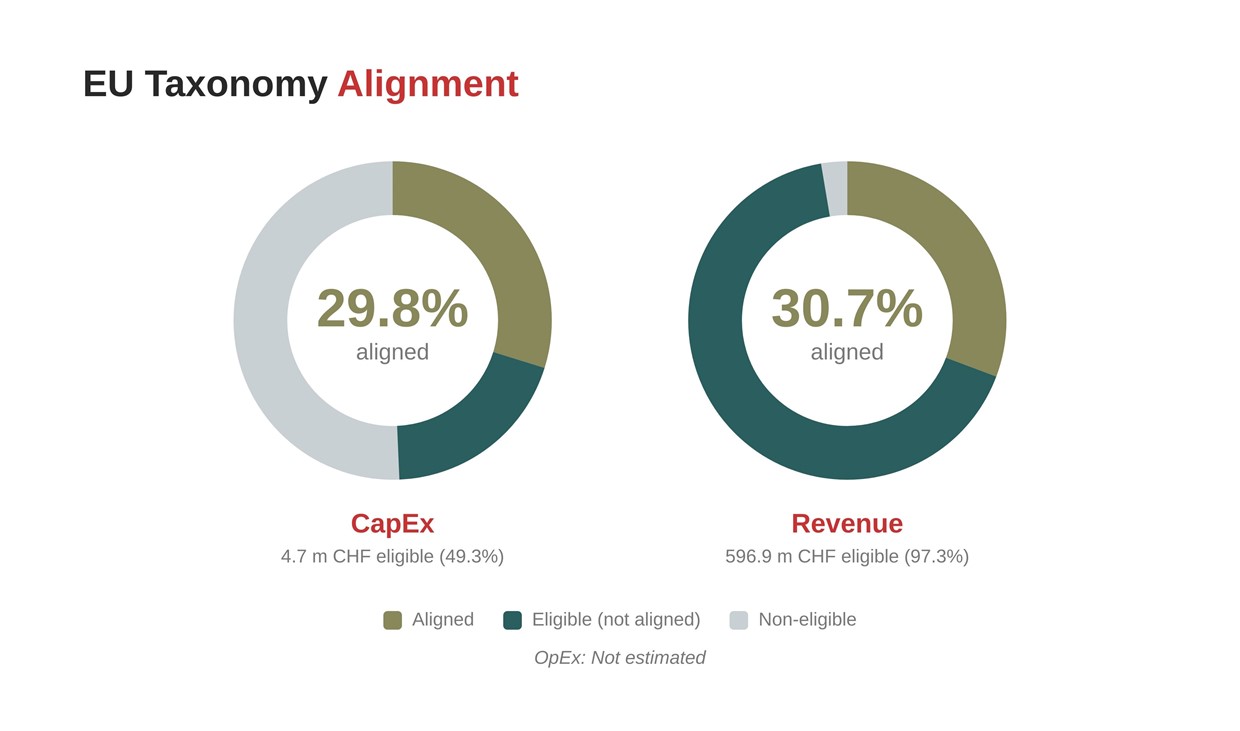
2.2 EU Taxonomy disclosure
- Introduction: The EU Taxonomy is a classification system that establishes a list of environmentally sustainable economic activities. Bystronic has conducted a comprehensive assessment of its activities using EU Taxonomy technical screening criteria.
- Reporting framework: This disclosure is prepared in accordance with Article 8 of the EU Taxonomy Regulation (2020/852) and Commission Delegated Regulation (EU) 2021/2178. Financial data follows Swiss GAAP FER accounting principles.
- Eligible economic activities identified: Based on the Climate Delegated Act, Bystronic has identified the following eligible activities.
- Activity 3.6 – manufacturing of other low carbon technologies: Manufacture of technologies aimed at substantial GHG emission reductions in other sectors of the economy. Bystronicʼs laser cutting and bending systems enable material efficiency and energy savings in customer operations across automotive, aerospace, construction, and general fabrication sectors.
- Activity 5.1 – repair, refurbishment and remanufacturing: Extension of product lifespans through professional servicing, refurbishment, and remanufacturing activities. Bystronicʼs service contracts and refurbishment services extend equipment lifecycles and reduce embodied emissions from new equipment manufacturing.
2.2.1 Alignment assessment approach
- Activity 3.6 – technical screening criteria: Requires that manufacturing technologies lead to substantial GHG emission reductions compared to best-performing alternative technologies. Bystronicʼs systems demonstrate energy efficiency improvements and material waste reduction compared to alternative metalworking technologies.
- Activity 5.1 – technical screening criteria: Requires that repair, refurbishment, or remanufacturing activities extend the useful life of products and components, thereby reducing resource consumption and lifecycle emissions. Bystronicʼs service contracts maintain equipment performance and extend machine lifetimes, while refurbishment activities return used equipment to operational condition. This activity represents the primary source of Bystronicʼs taxonomy-aligned revenue.
- DNSH assessment: Activities assessed against “Do No Significant Harm” criteria for all environmental objectives. Manufacturing operations maintain environmental compliance, manage water and waste responsibly, follow circular economy principles, and avoid significant pollution or biodiversity impacts.
- Minimum safeguards: Bystronic maintains a Code of Conduct aligned with international standards, whistleblowing mechanisms, human rights policies, and supplier due diligence processes ensuring alignment with minimum safeguard requirements.
2.2.2 KPI definitions–revenue
- Total revenue (denominator): Consolidated revenue per company Financial Statement. Machine sales revenue recognized at delivery/commissioning; service contracts recognized over contract period; software licenses recognized over term or at delivery for perpetual licenses.
- Taxonomy-aligned revenue (numerator): Revenue from activities meeting technical screening criteria, Do No Significant Harm (DNSH), and Minimum Safeguards. Service contracts are recognized as aligned revenue due to their significant positive effect on machine lifetime under activities 3.6 and 5.1. In the absence of standard criteria to evaluate alignment on machine sales, only eligible revenue was quantified.
2.2.3 KPI definitions – capital expenditures (CapEx)
- Total CapEx (denominator): Additions to property, plant & equipment (PPE) and intangible assets during reporting period, excluding assets acquired through business combinations, per Swiss GAAP FER.
- Taxonomy-aligned CapEx (numerator): CapEx directly supports aligned activities, including R&D facilities, production equipment for aligned products, and renewable energy infrastructure. Full disclosure available in EU Taxonomy tables.
2.2.4 KPI definitions – operating expenditures (OpEx)
- Total OpEx (denominator): Direct non-capitalized costs per EU Taxonomy definition: research & development, building renovation measures, short-term leases, maintenance and repair, and training and upskilling activities. Note: This is not total operating expenses but rather specific categories per the EU Taxonomy definition.
- Taxonomy-aligned OpEx (numerator): OpEx reporting has been omitted due to immateriality (less than 1% of total operating expenses).
|
EU Taxonomy |
Eligible |
|
Aligned |
|
% Eligible |
|
% Aligned |
|
Revenue |
596.9 m CHF |
|
188.2 m CHF |
|
97.3% |
|
30.7% |
|
CapEx |
4.7 m CHF |
|
2.8 m CHF |
|
49.3% |
|
29.8% |
|
OpEx |
Not estimated |
|
- |
|
- |
|
- |
- External assurance: EU Taxonomy KPIs presented in this disclosure are not yet subject to limited assurance.
2.3 Climate Change (ESRS E1)
Bystronic joined the Science-Based Targets initiative in 2023 and received validation of near-term targets in April 2025. The Group aims for a net-zero operations and net-zero value chain by 2050.
)
2.3.1 Transition plan (E1–1)
- Renewable electricity procurement: target 60% by 2027, 100% by 2030 (where possible)
- On-site renewable generation: solar installations at all major owned facilities by 2027
- Heating electrification: phase out natural gas heating at major owned facilities using geothermal and heat pumps (partially done)
- Fleet transition: 30% hybrid vehicles by 2027, 50% electric vehicles by 2030
2.3.2 Policies (E1–2)
- Supplier engagement: 30% EcoVadis coverage by 2026; encourage supplier SBTi adoption
- Low-carbon materials: 30% recycled steel content by 2028; fossil-free steel pilots by 2027
- Product efficiency: improved energy efficiency through optimized configuration and chiller
- Customer engagement: Life Cycle Assessment (LCA) data for 100% of products by 2027 available on demand
- Circular economy: Circulus project and upgrade services expansion
2.3.3 Actions and resources (E1–3)
- Climate policy: Board-approved climate strategy aligned with the Paris Agreement. Comprehensive emissions reduction roadmap covering all scopes. Regular progress monitoring through quarterly KPI reviews.
2.3.3.1 SBTi-validated targets
- Scope 1 & 2: 42% absolute reduction by 2030 from 2021 baseline
- Scope 3: 32.5% absolute reduction by 2033 from 2023 baseline
- Net-zero: operations and value chain by 2050
The baseline year for Scope 3 was updated to 2023 to reflect improved data quality and expanded category coverage achieved in 2023. In 2025, Scope 3 was recalculated to consider method improvement and Life Cycle Assessment results.
2.3.4 Decarbonization actions
2.3.4.1 Operational decarbonization
Bystronic advanced its renewable energy and low-carbon initiatives in 2025. Solar installations were completed at Niederönz (Switzerland), Hoffman Estates (USA), and Tianjin (China), with Foshan (China) finalized in late 2025. Geothermal heating became operational at Bystronic Laser AG in 2024, eliminating natural gas consumption and reducing Scope 1 emissions. In the USA, a Power Purchase Agreement with Verde Energy has supplied 100% renewable electricity to our facilities since June 2025. Renewable electricity contracts are active at Niederönz, Gotha (Germany), and Hoffman Estates, with a Foshan contract planned for 2026, subject to government grid operations.
2.3.4.2 Value chain decarbonization
Bystronic supports suppliers in establishing their own Science-Based Targets through workshops and guidance.
SSAB partnership renewed in 2025 for collaboration on fossil-free and recycled steel solutions. Pilot projects are ongoing with initial tests demonstrating comparable processing quality for fossil-free steel compared to conventional steel.
2.3.4.3 Product innovation
Bystronic products and solutions actively support customer sustainability and emissions reduction. Deep standby chillers, standard on all ByCut Fiber systems, achieve up to 50% idle energy reduction, lowering operational emissions during non-production periods. Nesting software provides digital optimization, achieving an average of 8% material waste reduction, which decreases both material costs and associated embodied emissions. Modular ByCut platforms use standardized designs that enable upgrades, extending system lifecycles by five or more years and reducing the need for equipment replacement and related production emissions. In addition, Bystronicʼs Life Cycle Assessment (LCA) program is expanding coverage of the product portfolio, providing customers with data to support Scope 3 reporting under emerging regulations.
2.3.5 Targets (E1–4)
|
GHG targets |
Baseline |
|
Target |
|
Status |
|
2025 |
|
Scope 1+2 (tCO₂e) |
12,028 (2021) |
|
6,976 (-42% by 2030) |
|
On track |
|
8,687 |
|
Scope 3 (tCO₂e) |
785,261 (2023) |
|
530,051 (-32.5% by 2033) |
|
Ahead |
|
672,699 |
2.3.6 Energy consumption and mix (E1–5)
The following table provides a detailed view of Bystronicʼs energy consumption over the last three years, categorized by activity type:
|
Energy consumption |
YoY |
2025 |
|
2024 |
|
2023 |
|
2022 |
|
2021 |
|
Total energy consumption (MWh) |
-8% |
35,407 |
|
38,509 |
|
39,576 |
|
41,664 |
|
43,861 |
|
Fuel for fleet |
|
14,520 |
|
15,139 |
|
14,268 |
|
15,042 |
|
14,949 |
|
Stationary energy (buildings) |
|
4,979 |
|
6,398 |
|
8,183 |
|
9,297 |
|
10,014 |
|
District heating |
|
2,347 |
|
2,490 |
|
2,905 |
|
2,246 |
|
2,226 |
|
Non-renewable electricity |
|
6,225 |
|
8,168 |
|
7,708 |
|
7,680 |
|
14,759 |
|
Renewable electricity |
|
7,335 |
|
6,314 |
|
6,513 |
|
7,399 |
|
1,912 |
|
Energy intensity (MWh/million CHF) |
|
57.7 |
|
59.4 |
|
42.6 |
|
41 |
|
46.7 |
|
|
|
|
|
|
|
|
|
|
|
|
|
Share of renewable electricity |
|
54% |
|
44% |
|
46% |
|
49% |
|
11% |
|
Share of renewable energy |
|
21% |
|
16% |
|
16% |
|
18% |
|
4% |
Analysis of energy consumption and intensity evolution
The data indicates an 8% year-over-year decrease in total energy consumption in 2025, highlighting effective energy management strategies and a decrease in manufacturing activities. The increase in the share of renewable electricity from 11% in 2021 to 54% in 2025 demonstrates a significant shift towards more sustainable energy sources. The energy intensity saw a peak in 2024 due to reduced revenue during the CORE restructuring period.
2.3.7 GHG emissions (E1–6)
)
Scope 1, 2 emissions
|
GHG emissions Scope 1 & 2 |
2025 |
|
2024 |
|
2023 |
|
2022 |
|
2021 |
|
Scope 1 (tCO₂e) |
5,108 |
|
5,559 |
|
6,126 |
|
7,110 |
|
6,678 |
|
Fuel for fleet |
3,937 |
|
4,035 |
|
3,871 |
|
4,236 |
|
4,197 |
|
Stationary energy |
1,102 |
|
1,428 |
|
1,836 |
|
2,119 |
|
2,265 |
|
Refrigerants |
69 |
|
97 |
|
419 |
|
755 |
|
216 |
|
Scope 2 market-based (tCO₂e) |
3,579 |
|
4,567 |
|
4,384 |
|
4,303 |
|
5,350 |
|
Non-renewable electricity |
2,864 |
|
3,807 |
|
3,543 |
|
3,464 |
|
4,509 |
|
District heating |
715 |
|
761 |
|
840 |
|
840 |
|
841 |
|
Scope 1+2 total (tCO₂e) |
8,687 |
|
10,127 |
|
10,510 |
|
11,413 |
|
12,028 |
|
GHG intensity (tCO₂e/million CHF) |
14.2 |
|
15.6 |
|
11.3 |
|
11.2 |
|
12.8 |
Analysis of GHG emissions and intensity evolution
Scope 1 emissions decreased 24% from 2021 baseline, driven by natural gas elimination through geothermal heating and fleet efficiency improvements. Scope 2 market-based emissions decreased 33% from baseline through renewable electricity procurement. Decreased manufacturing activities in Europe were a strong contributor to Scope 1 and 2 emission reductions, while being a non-structural factor. Total Scope 1 +2 emissions of 8,687 tCO₂e in 2025 represent a 28% reduction from 2021 baseline, tracking ahead of 2030 target trajectory.
Although sales have not yet recovered, Scope 1 & 2 CO₂e emissions intensity has decreased thanks to strong decarbonization measures in 2025, more than offsetting the revenue decline.
Scope 3 emissions by category
|
GHG emissions Scope 3 |
Since 2023 |
YoY |
2025 |
|
2024 |
|
2023 |
|
Scope 3 total emissions (tCO₂e) |
-14% |
6% |
672,699 |
|
632,262 |
|
785,261 |
|
Cat 1 - Purchased goods & services |
|
|
111,552 |
|
109,777 |
|
124,524 |
|
Cat 2 - Capital goods |
|
|
523 |
|
444 |
|
557 |
|
Cat 3 - Fuel- and energy-related activities |
|
|
1,917 |
|
2,190 |
|
1,970 |
|
Cat 4 - Upstream transportation and distribution |
|
|
2,006 |
|
1,795 |
|
2,002 |
|
Cat 5 - Waste generated in operations |
|
|
194 |
|
200 |
|
263 |
|
Cat 6 - Business travel |
|
|
5,835 |
|
6,078 |
|
4,078 |
|
Cat 7 - Employee commuting |
|
|
8,042 |
|
8,617 |
|
10,049 |
|
Scope 3 upstream emissions |
|
|
130,069 |
|
129,101 |
|
143,443 |
|
Cat 9 - Downstream transportation and distribution |
|
|
10,564 |
|
9,797 |
|
13,303 |
|
Cat 11 - Use of sold products |
|
|
529,376 |
|
490,613 |
|
624,744 |
|
Cat 12 - End-of-life treatment |
|
|
2,690 |
|
2,751 |
|
3,770 |
|
Scope 3 downstream emissions |
|
|
542,630 |
|
503,161 |
|
641,818 |
Analysis of GHG emissions and intensity evolution
Scope 3 emissions account for 99% of Bystronicʼs carbon footprint. Category 11 (use of sold products) represents 79%, based on electricity consumption throughout the entire product lifecycle per GHG protocol guidelines. Category 1 (purchased goods and services) represents 17%. Scope 3 emissions increased 6% year-over-year. While manufacturing volumes remained stable – offering no volume-driven emission reduction – the product mix shifted toward higher-powered laser systems, which carry higher lifetime energy consumption and therefore higher estimated use-phase emissions.
New calculation method reduced Scope 3 by 30% compared to previous results (see previous reports). Scope 3 emissions have been recalculated to incorporate new Life Cycle Assessment data in Scope 3 Category 11 – Use of sold products (flat laser machine lifetime has been reduced from 20 years to 10 years) and in Scope 3 Category 1 – purchased goods and services (spend method has been replaced by weight method for accuracy improvement). Baseline and target years have been recalculated according to the Science-Based Target reduction plan of 32.5% over the 2023–2033 period.
2.3.8 Customer decarbonization impact
Bystronicʼs laser cutting systems integrate sustainability features across three dimensions – energy efficiency, circularity, and material efficiency – that directly reduce customersʼ operational emissions, resource consumption, and total cost of ownership. The illustration below shows how these features are embedded across the system architecture.
)
2.3.8.1 Product efficiency features
- Deep standby chiller: Achieves up to 50% reduction in idle energy consumption compared to the previous generation. Standard on all ByCut Fiber systems. Reduces customer operational emissions during non-production periods such as nights and weekends. Annual energy savings per system estimated to reach return on investment within three years for most customers.
- Nesting software: Digital optimization tool analyzes part layouts to maximize material utilization. Achieves 8% average material waste reduction across customer applications. Reduces both material costs and associated embodied emissions from steel production. Annual material savings per customer site estimated at one week of annual purchased steel.
- Intelligent Cutting Process (ICP): A coaxial camera monitors the cutting process through the nozzle of the fiber laser and ensures reliability through proactive and reactive measures. This reduces downtime and material waste in case of nozzle loss. By preventing unrecognized cut interruptions, the ICP feature helps minimize waste.
- Parameter Wizard with Artificial Intelligence (AI): This feature combines intelligent human-machine interaction and AI-based optimization to support the operator when a new type of metal is introduced. Leveraging AI helps to quickly and precisely define the correct parameters to optimize cutting quality, eliminating the need for time-consuming trial and error methods.
- Nozzle Control Tool (NCT) & KerfScan: NCT enables automatic nozzle centering in seconds and monitors nozzle condition and type. KerfScan examines the oxygen cut to detect residual slag inside the cutting gap/kerf, which allows parts to be recut as needed. This combination ensures a consistent, high-quality cutting process that reduces waste and rejected parts.
- Laser Angle Measurement System (LAMS): This feature ensures precision and productivity in the bending process by eliminating the need for time-intensive measuring and part correcting. LAMS optimizes metal waste reduction by achieving precise angles and minimizing misshaping, ensuring that the first bend is flawless.
- Nitrogen generators: Nitrogen generators, like NitroCube and Airco System, enable in-house production of high-purity nitrogen for fiber laser cutting systems, reducing energy use and carbon emissions. In Bystronicʼs life cycle assessment, nitrogen use was the largest contributor to indirect CO₂ emissions. Traditional methods require substantial power and transportation, increasing the carbon footprint. In-house generation eliminates the need for transport and allows efficient, on-demand nitrogen production, offering environmental and financial benefits.
- Modular platforms: ByCut standardization enables component upgrades rather than complete system replacement. Extends productive lifecycle five or more years beyond traditional replacement cycles. Reduces the need for new system production and associated manufacturing emissions. Customer investment in upgrades is typically 30–40% of new system cost with comparable performance improvements.
- Material innovation: Partnership with SSAB advances technologies for innovative materials including high-strength alloys, recycled steel content, and fossil-free steel production. This collaboration supports the transition toward lower-carbon material options across the value chain.
- Fossil-free steel: Initial tests conducted in 2025 demonstrate that fossil-free steel can be processed with comparable quality to conventional steel. Cutting quality, edge characteristics, and processing speeds meet customer specifications. Enables customer decarbonization pathways as fossil-free steel becomes commercially available. Potential emission reduction of up to 95% compared to conventional steel production.
- Recycled steel: Laser cutting and bending systems optimized for recycled steel grades with varying material properties. Material database includes processing parameters for multiple recycled content levels. Supports customer sustainability goals through use of secondary materials.
2.3.8.2 Life Cycle Assessment program
Standardized Life Cycle Assessment methodology per ISO 14040/14044 applied to product portfolio. LCA scope includes raw material extraction and processing, component manufacturing and assembly, transportation and distribution, use-phase energy consumption, and end-of-life treatment options.
Coverage expanding from current ~60% to 100% of standard products by 2027. Results provided to customers to support their Scope 3 reporting requirements under emerging regulations including CSRD and SEC climate disclosure rules. Data enables customers to quantify emissions associated with capital equipment purchases.
2.3.8.3 Customer engagement
Joint pilot projects with lead customers test new sustainability features before commercial launch. Industry partnerships through associations advance sustainability standards and benchmarks collaboratively. Transparency through publicly available sustainability datasheets for all products. Integration with customer carbon accounting software platforms facilitates emissions tracking and reporting.
2.4 Water & Marine Resources (ESRS E3)
2.4.1 Policies (E3–1)
Environmental management systems cover water management at ISO 14001 certified sites. Site-specific water efficiency programs identify reduction opportunities. Wastewater treatment ensures discharge compliance with local regulations.
2.4.2 Actions and resources (E3–2)
Water consumption monitoring implemented at manufacturing sites with quarterly reporting. Closed-loop water systems installed where technically and economically feasible, particularly at headquarters. Discharge permit compliance maintained at all facilities with wastewater treatment requirements.
WRI Aqueduct Water Risk Atlas used to assess water stress at all facility locations. Tianjin (China) site classified as high baseline water stress.
2.4.3 Metrics and targets (E3–3 & E3–4)
Water withdrawal and consumption in manufacturing plants (m³)
|
Water management |
YoY |
2025 |
|
2024 |
|
2023 |
|
2022 |
|
Water consumption in manufacturing plants (m³) |
–21% |
18,532 |
|
23,562 |
|
23,664 |
|
12,274 |
|
Water withdrawal |
|
18,659 |
|
24,259 |
|
23,664 |
|
12,274 |
|
Water discharged |
|
127 |
|
697 |
|
|
|
|
|
Water intensity per net sales (m³/million CHF) |
|
30.2 |
|
36.3 |
|
25.4 |
|
12.1 |
Analysis: We started monitoring water consumption in 2022 with a limited number of manufacturing plants. In 2025 we had data coverage for six of nine manufacturing sites. Coverage expansion remains a priority.
Water stress assessment: 39% of total water withdrawal occurs in medium-high to extremely high water stress areas. This concentration drives focused risk management and adaptation efforts.
|
Water by location |
Water stress |
% of Total |
|
Actions |
2025 |
|
2024 |
|
Bystronic Tianjin (China) |
Extremely High (4-5) |
39% |
|
Monitoring |
7,267 |
|
8,146 |
|
Bystronic Laser (Romania) |
High (3-4) |
3% |
|
Closed plant |
617 |
|
987 |
|
Bystronic Manufacturing (USA) |
Medium-High (2-3) |
7% |
|
Monitoring |
1,289 |
|
1,336 |
|
Bystronic Tube Processing (Italy) |
Medium-High (2-3) |
6% |
|
Monitoring |
1,146 |
|
2,242 |
|
Other locations |
Low to Medium (0-2) |
45% |
|
- |
8,213 |
|
11,548 |
2.5 Resource Use & Circular Economy (ESRS E5)
2.5.1 Policies (E5–1)
Bystronicʼs circular economy strategy follows the waste hierarchy, focusing first on preventing waste through product design, reducing material consumption via process and software optimization, reusing components and materials where feasible, recycling materials at end-of-life, and recovering energy only as a last resort. Material efficiency targets have been established for both product design and manufacturing operations to drive continuous improvements and support sustainable resource use.
2.5.2 Actions and resources (E5–2)
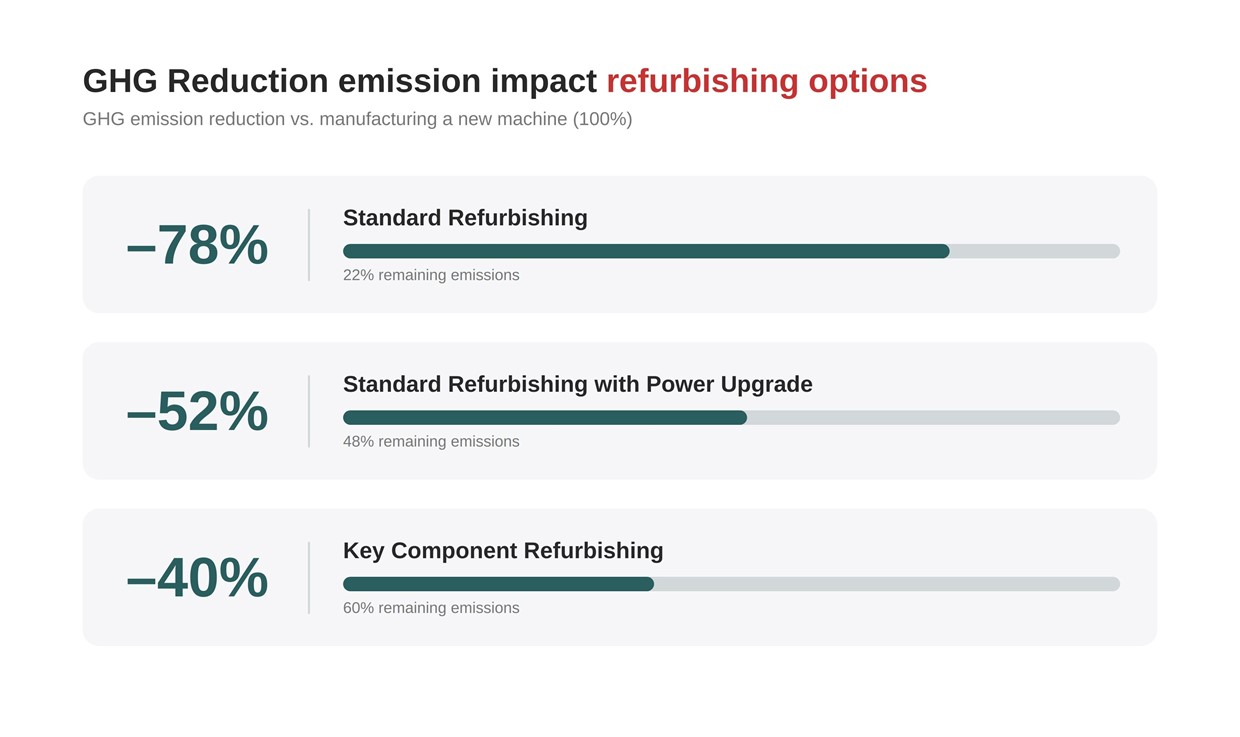
- Innosuisse circular economy project Circulus: Four-year collaboration with Swiss Innovation Agency focuses on circularity use cases with completion targeted for 2028.
- Use case 1 – deep refurbishment program: Program extends operational life of BySprint laser cutting systems by five or more years through comprehensive refurbishment. Bystronic is developing a refurbishing kit for the BySprint laser cutting machine, forming the basis of a new circular business model that extends the lifetime of the installed machine base. The approach focuses on replacing only components that have reached end-of-life, offering customers a cost-effective alternative to purchasing new equipment. Three refurbishing options are available: (i) standard refurbishing, extending machine lifetime by five years; (ii) standard refurbishing with power upgrades to enhance performance; and (iii) optional refurbishment with replacement of key components. Initial life-cycle assessments indicate significant GHG emission reductions compared to new machines, amounting to 77%, 49%, and 36% respectively.
Read more about the Circulus project here.
- Use case 2 – circular design integration: Program integrates circular economy principles into new laser cutting system development from earliest design stages. Focus areas include improved material selection through higher recycled content and mono-materials simplifying recycling, enhanced modularity enabling component upgrades without full system replacement, facilitated component reuse through standardized interfaces and documentation, and simplified end-of-life disassembly through design for disassembly principles.
Extending product life through laser module refurbishment
Bystronicʼs laser module refurbishment program demonstrates how circular economy principles translate into measurable impact. Rather than replacing high-value components at end-of-service, we developed an industrial refurbishment process that recovers usable assemblies, recalibrates optical paths, and restores cutting heads to original performance standards – often with enhanced monitoring capabilities. This approach goes beyond basic repair: each laser module is stripped, cleaned, realigned, and rebuilt from the optics upward, delivering performance-secure components with significantly reduced resource consumption compared to new production. The program delivers environmental and economic value. From a circularity perspective, refurbished laser modules avoid the material extraction, machining, and manufacturing emissions associated with new component production while keeping structurally sound parts in the use cycle, embodying the principle of reuse over replacement. Customers benefit from reduced capital expenditure, minimized downtime, and the confidence that older machines remain competitive in demanding production environments.
These initiatives position Bystronic as a circular economy leader in the capital equipment industry, creating value through resource efficiency while meeting increasing customer and regulatory demands for circularity.
2.5.3 Metrics and performance (E5–4)
Resource inflows in manufacturing plants:
|
Resource inflows |
2025 |
|
2024 |
|
2023 |
|
Total purchased goods (tons) |
26,261 |
|
22,738 |
|
29,423 |
|
Amount of metals (tons) |
23,970 |
|
20,963 |
|
27,517 |
|
Share of recycled steel (%) |
27% |
|
27% |
|
27% |
|
Estimated recycled content (tons) |
6,472 |
|
5,660 |
|
7,429 |
Analysis: Total purchased goods increased due to the increased number of large size machines produced in China. Recycled steel content remained at 27%, meeting minimum target. Opportunities exist to increase recycled content through supplier collaboration and specification changes.
2.5.4 Material flow analysis (E5–5)
Waste generation and management
|
Waste in manufacturing plants |
YoY |
2025 |
|
2024 |
|
2023 |
|
2022 |
|
2021 |
|
Waste, total amount in manufacturing plants (tons) |
–6% |
2,150 |
|
2,288 |
|
3,323 |
|
3,860 |
|
4,267 |
|
Non-hazardous waste |
|
2,103 |
|
2,241 |
|
3,266 |
|
3,785 |
|
4,213 |
|
Metals |
|
1,511 |
|
1,593 |
|
2,400 |
|
2,989 |
|
3,253 |
|
Wood |
|
160 |
|
176 |
|
375 |
|
465 |
|
575 |
|
Paper & cardboard |
|
116 |
|
102 |
|
117 |
|
137 |
|
218 |
|
Plastics |
|
5 |
|
4 |
|
6 |
|
6 |
|
7 |
|
Domestic |
|
307 |
|
346 |
|
354 |
|
176 |
|
156 |
|
Special non-hazardous waste |
|
4 |
|
18 |
|
13 |
|
11 |
|
4 |
|
Hazardous waste & toxic material |
|
47 |
|
47 |
|
57 |
|
75 |
|
54 |
|
Waste by disposal methods (%) |
|
|
|
|
|
|
|
|
|
|
|
Landfill |
|
0% |
|
1% |
|
1% |
|
1% |
|
|
|
Incineration |
|
15% |
|
15% |
|
10% |
|
5% |
|
|
|
Share of metal waste (mostly recycled) |
|
83% |
|
81% |
|
87% |
|
92% |
|
|
|
Other disposal methods |
|
2% |
|
3% |
|
2% |
|
2% |
|
|
|
Waste intensity per net sales (tons/million CHF) |
|
2.7 |
|
2.9 |
|
3.6 |
|
3.8 |
|
4.5 |
Analysis: Total waste generation in 2025 was 2,150 ton compared to the 4,267 ton baseline in 2021, representing a 50% reduction and exceeding the 2030 target of 3,413 tons early. This achievement reflects reduced manufacturing activity during CORE restructuring and improved material efficiency. Recycling rate is at 83% as most metal waste (70%) and wood, paper and cardboard waste (pallet, packaging) is recycled.
With the closure of our plant in Romania, we ended all waste to landfill in 2025.
Waste by disposal method
- Recycling, reuse & recovery: 83% (metal, wood, paper and cardboard waste)
- Incineration: 15% (plastic and domestic waste)
- Other disposal methods: 2% (special and hazardous waste)
- Landfill: 0%
2.5.5 Outlook and priorities
2.5.5.1 2025–2027 Circular economy priorities
- Product design: Complete Innosuisse Circulus deep refurbishment project for BySprint Fiber systems and commercialize refurbishment offerings across European markets. Integrate Design for Disassembly (DfD) criteria into new product development stage-gate process by 2026. Increase material recovery rate through improved disassembly processes and component documentation. Expand LCA coverage to 100% of product portfolio from current ~60%.
- Supplier collaboration: Increase recycled steel content to 30% by 2028 through supplier partnerships and material specification updates. Develop circular packaging standards with top suppliers to reduce single-use packaging. Engage suppliers on material passport development providing composition and recyclability data for major components.
- Customer circular economy: Expand refurbished machine offerings across all product lines with standardized quality and warranty programs. Develop deep refurbishment service centers in Europe and North America. Create “Upgrade-as-a-Service” offerings enabling customers to access latest technology through modular upgrades rather than full replacement. Provide component remanufacturing services to extend life of high-value components.
- Manufacturing: Improve overall waste recycling rate to 90% by 2027.
- Long-term ambitions (2030): 100% of standard product lines with circular design certification from third-party verifier. 50% recycled content in purchased materials (mainly steel). Improved material recovery rate from end-of-life equipment through take-back programs. Circular economy services represent major part of total revenue.